

FOMC preview: Tariffs begin to bite, and the labor market softens
Chief Economist Eugenio J. Alemán discusses current economic conditions.
With the Federal Open Market Committee (FOMC) meeting on the horizon, we’ve taken a closer look at recent economic developments to better understand the landscape Federal Reserve (Fed) officials will be navigating during the two-day meeting, which begins September 16.
The August Producer Price Index (PPI) came in softer than anticipated, reflecting a partial reversal of July’s sharp gains. Services prices led the decline, while goods prices posted only a modest increase. The July surge had been driven by strong growth in capital equipment purchases, as firms increased purchases due to higher tariffs scheduled to take effect in August, and energy costs, but both categories saw a pullback in August. Lower energy prices and reduced private capital equipment spending, across both government and private sectors, contributed to the overall softness in August. Looking ahead, the inflationary impact of tariffs is expected to become more pronounced, potentially exerting upward pressure on input costs.
In contrast, the Consumer Price Index (CPI) surprised to the upside in August, largely due to a stronger than expected increase in shelter costs. Food prices rose 0.5%, likely reflecting the early effects of tariffs, with notable increases in tariff-sensitive items such as tomatoes and coffee. Apparel prices also climbed 0.5%, marking the third consecutive monthly increase. Core goods inflation posted its strongest gain since May 2023, rising 0.3%, driven by a 1.0% increase in used vehicle prices and a 0.3% rise in new vehicles. Meanwhile, non-tariffed items like medicinal drugs saw a 0.4% decline.
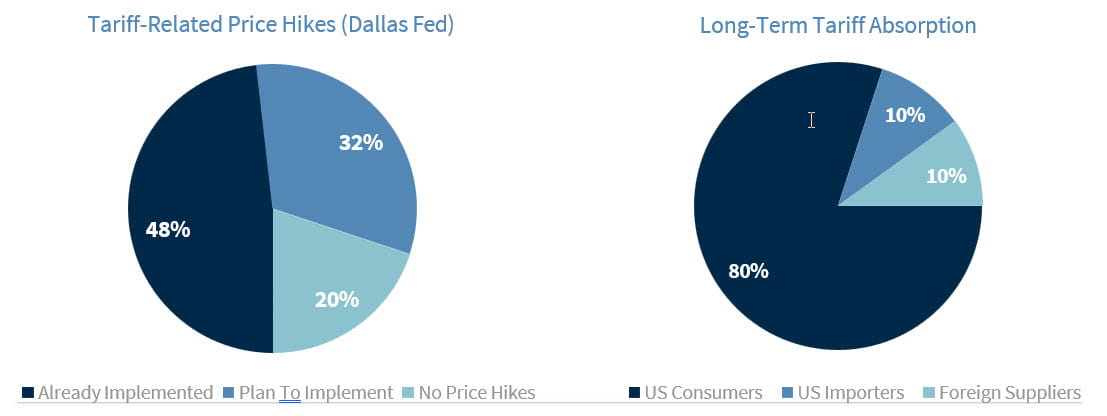
These developments suggest that tariffs are beginning to influence consumer inflation. While a recent Dallas Fed survey1 indicates that only 48% of companies have raised prices so far, we estimate that by 2026, up to 80% of tariff costs will be passed on to consumers. Fortunately, goods inflation accounts for just 36% of the CPI basket, suggesting the impact may be contained and transitory, and unlikely to approach the inflation peaks of 2022.
However, the broad-based rise in consumer prices complicates the Fed’s policy outlook. Persistent inflation risks may limit the Fed’s ability to pursue aggressive rate cuts. Despite this, we continue to expect a 25 basis point rate cut in September, with at least one additional cut likely before year-end. A larger 50 basis point cut appears increasingly unlikely unless Fed officials perceive a significant recession risk.
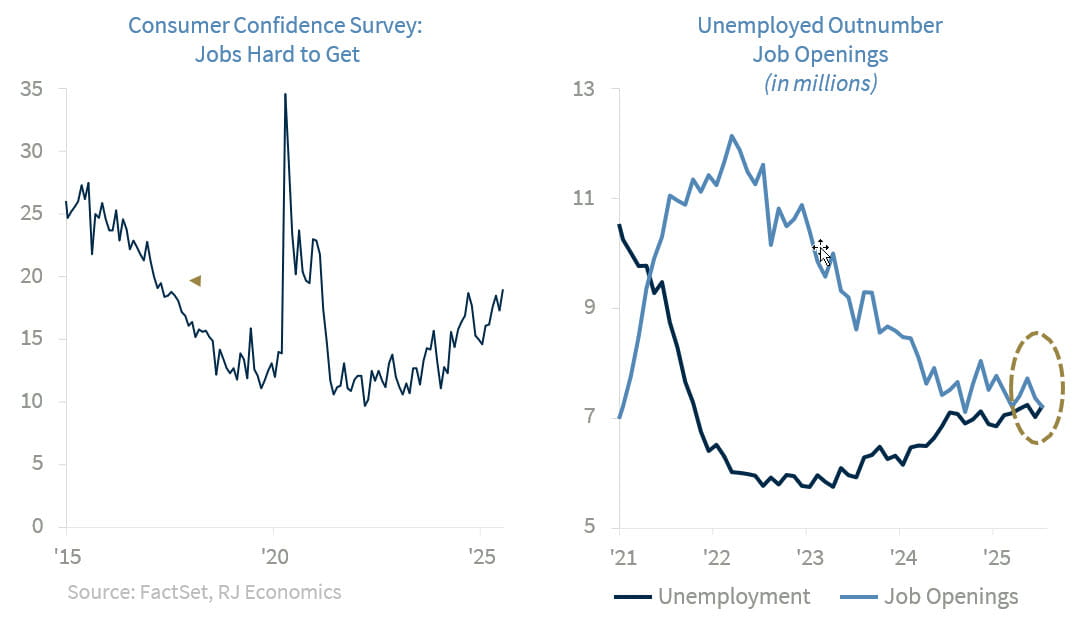
The labor market remains a key concern. Nonfarm payrolls have softened, and recent BLS benchmark revisions underscore this trend. Surveys show weakening hiring plans, the lowest job-finding expectations since 2013, and more unemployed workers than job openings for the first time since 2021. Initial jobless claims recently spiked to their highest level since October 2021. While this jump may be distorted by seasonal factors and a large increase in unadjusted claims in Texas, the underlying trend points to continued labor market deterioration. With small businesses, which are responsible for over half of US employment, facing high single-digit borrowing costs, hiring plans are unlikely to improve.
One of the most closely watched indicators ahead of the September 16-17 FOMC meeting is the September 16 retail sales report, which will provide a timely snapshot of consumer spending behavior in the third quarter. July’s report showed a solid 0.5% increase in the control group, which feeds directly into GDP calculations, suggesting resilient demand despite elevated borrowing costs and inflationary pressures. However, it’s crucial to remember that retail sales are reported in nominal terms, meaning they are not adjusted for inflation. This distinction matters because if prices rise due to tariffs or other cost pressures, the headline retail sales figure could increase even if actual consumption volumes remain flat or decline.
In this context, the August CPI report takes on added significance. With tariff-sensitive categories like food, apparel, and vehicles posting notable price increases, there’s a possibility that the retail sales data could be inflated by higher prices rather than stronger demand. A strong nominal print may not necessarily reflect robust real consumption, especially if households are simply paying more for the same goods.
Finally, the September 16-17 FOMC meeting and the release of its Summary of Economic Projections (SEP) will be an important moment for markets. This quarterly update offers the Fed’s latest forecasts for GDP growth, unemployment, inflation, and the federal funds rate, providing a window into how policymakers interpret recent economic developments. With most tariffs now fully implemented and imports actively taxed, the SEP will likely reflect updated economic projections.
Markets will be watching closely for any upward revisions to the Fed’s inflation outlook, especially in the core PCE measure, which excludes volatile food and energy prices. Any shift in the Fed’s median dot plot could signal a change in the expected pace or magnitude of rate cuts. If inflation is seen as more persistent due to tariff pass-through or supply chain disruptions, the Fed may opt for a more cautious approach to easing.
Conversely, if the SEP reflects growing concern about labor market deterioration, weakening consumer demand, and tighter credit conditions, the Fed may lean more dovish. The balance between inflation risks and growth concerns will be central to the Fed’s messaging, and the SEP will help clarify how officials are weighing these competing forces.
Economic and market conditions are subject to change.
Opinions are those of Investment Strategy and not necessarily those of Raymond James and are subject to change without notice. The information has been obtained from sources considered to be reliable, but we do not guarantee that the foregoing material is accurate or complete. There is no assurance any of the trends mentioned will continue or forecasts will occur. Past performance may not be indicative of future results.
Consumer Price Index is a measure of inflation compiled by the US Bureau of Labor Statistics. Currencies investing is generally considered speculative because of the significant potential for investment loss. Their markets are likely to be volatile and there may be sharp price fluctuations even during periods when prices overall are rising.
Consumer Sentiment is a consumer confidence index published monthly by the University of Michigan. The index is normalized to have a value of 100 in the first quarter of 1966. Each month at least 500 telephone interviews are conducted of a contiguous United States sample.
Personal Consumption Expenditures Price Index (PCE): The PCE is a measure of the prices that people living in the United States, or those buying on their behalf, pay for goods and services. The change in the PCE price index is known for capturing inflation (or deflation) across a wide range of consumer expenses and reflecting changes in consumer behavior.
The Consumer Confidence Index (CCI) is a survey, administered by The Conference Board, that measures how optimistic or pessimistic consumers are regarding their expected financial situation. A value above 100 signals a boost in the consumers’ confidence towards the future economic situation, as a consequence of which they are less prone to save, and more inclined to consume. The opposite applies to values under 100.
Certified Financial Planner Board of Standards Center for Financial Planning, Inc. owns and licenses the certification marks CFP®, CERTIFIED FINANCIAL PLANNER®, and CFP® (with plaque design) in the United States to Certified Financial Planner Board of Standards, Inc., which authorizes individuals who successfully complete the organization’s initial and ongoing certification requirements to use the certification marks.
Links are being provided for information purposes only. Raymond James is not affiliated with and does not endorse, authorize or sponsor any of the listed websites or their respective sponsors. Raymond James is not responsible for the content of any website or the collection or use of information regarding any website's users and/or members.
GDP Price Index: A measure of inflation in the prices of goods and services produced in the United States. The gross domestic product price index includes the prices of U.S. goods and services exported to other countries. The prices that Americans pay for imports aren't part of this index.
Employment cost Index: The Employment Cost Index (ECI) measures the change in the hourly labor cost to employers over time. The ECI uses a fixed “basket” of labor to produce a pure cost change, free from the effects of workers moving between occupations and industries and includes both the cost of wages and salaries and the cost of benefits.
US Dollar Index: The US Dollar Index is an index of the value of the United States dollar relative to a basket of foreign currencies, often referred to as a basket of U.S. trade partners' currencies. The Index goes up when the U.S. dollar gains "strength" when compared to other currencies.
The FHFA HPI is a broad measure of the movement of single-family house prices. The FHFA HPI is a weighted, repeat- sales index, meaning that it measures average price changes in repeat sales or refinancings on the same properties.
Import Price Index: The import price index measure price changes in goods or services purchased from abroad by U.S. residents (imports) and sold to foreign buyers (exports). The indexes are updated once a month by the Bureau of Labor Statistics (BLS) International Price Program (IPP).
ISM Services PMI Index: The Institute of Supply Management (ISM) Non-Manufacturing Purchasing Managers' Index (PMI) (also known as the ISM Services PMI) report on Business, a composite index is calculated as an indicator of the overall economic condition for the non-manufacturing sector.
The ISM Manufacturing Index: The GDP Now Institute of Supply Management (ISM) Manufacturing Measures the health of the manufacturing sector by surveying purchasing managers at manufacturing firms. The survey asks about current business conditions and expectations for the future, including new orders, inventories, employment, and deliveries.
Consumer Price Index (CPI) A consumer price index is a price index, the price of a weighted average market basket of consumer goods and services purchased by households.
Producer Price Index: A producer price index (PPI) is a price index that measures the average changes in prices received by domestic producers for their output.
Industrial production: Industrial production is a measure of output of the industrial sector of the economy. The industrial sector includes manufacturing, mining, and utilities. Although these sectors contribute only a small portion of gross domestic product, they are highly sensitive to interest rates and consumer demand.
The NAHB/Wells Fargo Housing Opportunity Index (HOI) for a given area is defined as the share of homes sold in that area that would have been affordable to a family earning the local median income, based on standard mortgage underwriting criteria.
Conference Board Coincident Economic Index: The Composite Index of Coincident Indicators is an index published by the Conference Board that provides a broad-based measurement of current economic conditions, helping economists, investors, and public policymakers to determine which phase of the business cycle the economy is currently experiencing.
Conference Board Lagging Economic Index: The Composite Index of Lagging Indicators is an index published monthly by the Conference Board, used to confirm and assess the direction of the economy's movements over recent months.
New Export Index: The PMI New export orders index allows us to track international demand for a country's goods and services on a timely, monthly, basis.
Gold is subject to the special risks associated with investing in precious metals, including but not limited to: price may be subject to wide fluctuation; the market is relatively limited; the sources are concentrated in countries that have the potential for instability; and the market is unregulated.
The Conference Board Leading Economic Index: Intended to forecast future economic activity, it is calculated from the values of ten key variables.
Source: FactSet, data as of 7/25/2025
